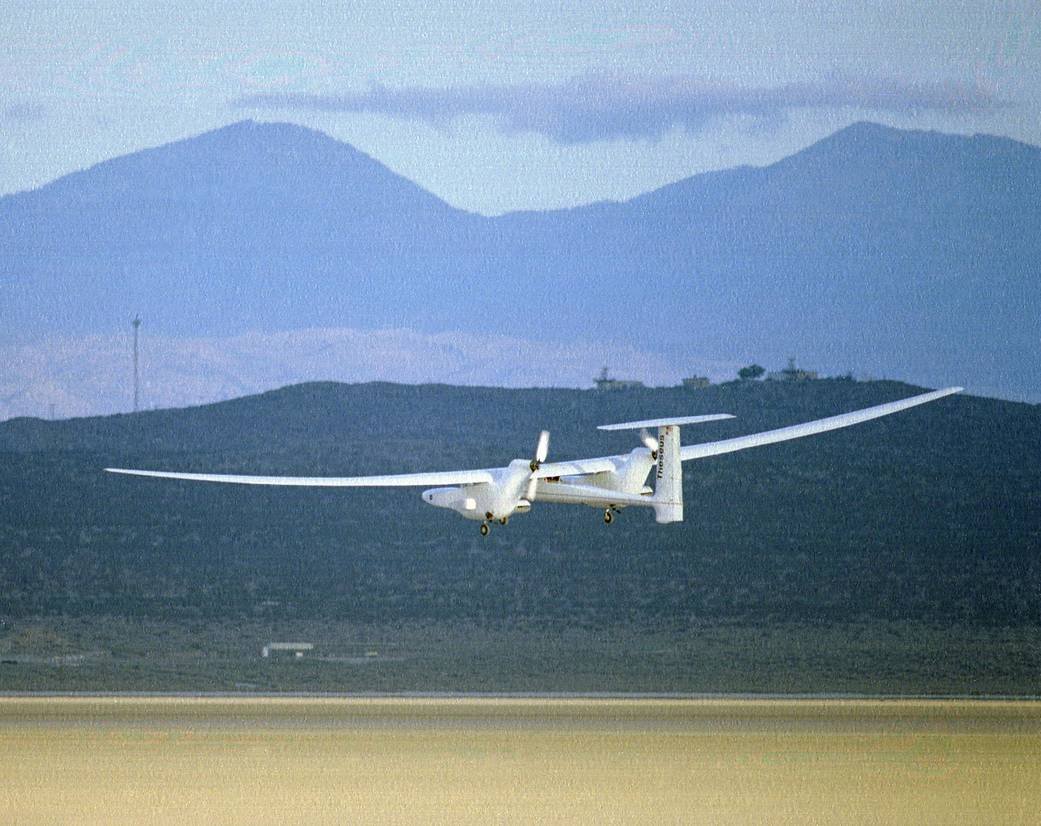
A longer wing can reduce the drag associated with producing lift. But an efficient aircraft also needs a wing that carries its loads, stays sufficiently stiff, and can be built and maintained. The useful engineering question is how much aerodynamic benefit a change buys—and what else must change with it.
This research review connects a foundational NASA contractor report with a simple, inspectable calculation. The interactive example below lets you compare two wingspans while holding the other inputs fixed. It is an educational concept study, not new experimental research or a validated aircraft design.
1. What the research tells us
J. E. Yates and C. D. Donald’s A Fundamental Study of Drag and an Assessment of Conventional Drag-Due-to-Lift Reduction Devices examines lifting configurations using conservation laws. Published as NASA-CR-4004 in 1986, it distinguishes induced drag associated with spanwise loading from form drag associated with lift. That distinction matters: changing span does not automatically improve every contribution to aircraft drag. [1]
The report argues for evaluating aerodynamic and structural effects together. It also discusses how wingtip devices must be designed with the wing: an addition can be detrimental when the combined loading is unsuitable. Its assumptions include steady, symmetric flight and high Reynolds numbers. We use it for the design lesson, not as validation of the small-aircraft example below. [1]
For the simple planar-wing model used here, the span efficiency factor e describes departure from an ideal elliptical lift distribution. The ideal value is 1; an assumed value of 0.8 is used in the demonstration. Actual efficiency must come from a suitable analysis or data. This input is not a measured property of the aircraft shown in the photographs. [2]
2. Four equations make the estimate traceable
Aspect ratio describes span relative to area. With wingspan b in metres and planform area S in square metres, AR = b² / S. For steady, level, unaccelerated flight, the example assigns the aircraft’s weight to the wing lift: L = mg, using g = 9.80665 m/s². Tail lift and other vertical force contributions are omitted.
CL = mg / (qS)
CDi = CL² / (π · AR · e)
Di = qS · CDi
Here q is dynamic pressure in pascals, ρ is air density in kg/m³, V is true airspeed in m/s, CL is lift coefficient, and Di is induced drag in newtons. The same wing reference area is used throughout. The equations follow the lift, drag and induced-drag relationships in the linked NASA Glenn educational references. [2] [3] [4]
The output also includes Di × V in watts. This is the aerodynamic power associated with the induced component. Calculating required battery or engine power would additionally need total drag and propulsion efficiency.
Compare two wingspans.
Change the example inputs, then calculate. Both wings use the same mass, area, speed, density and efficiency. Calculations run in your browser.
Model scope: a planar wing in steady level flight at low speed with attached flow. This estimate excludes profile and parasite drag, stall, compressibility, structural loads, flutter and flight approval. Input limits are software limits, not an operating envelope. Use suitable aerodynamic data to assess applicability.
| Quantity | Baseline | Comparison |
|---|
A review prompt appears for AR below 4 or required CL above 1.2. These prompts are conservative editorial checks, not universal theory boundaries or stall predictions. Passing them does not establish that a design can fly.
3. A worked example you can reproduce
Consider a hypothetical 10 kg aircraft with a 0.75 m² wing, flying at 25 m/s in air with density 1.225 kg/m³. Set e = 0.8 for both cases. At 3.0 m span, AR is 12; at 3.3 m, AR is 14.52. The model requires 98.0665 N of lift, and q is 382.8125 Pa.
| Result | 3.0 m span | 3.3 m span |
|---|---|---|
| Required CL | 0.341565 | 0.341565 |
| Induced drag | 1.110639 N | 0.917883 N |
| Induced aerodynamic power | 27.765972 W | 22.947084 W |
Substituting AR = b²/S and CL = L/(qS) gives a useful independent check: Di = L²/(qπeb²). At fixed lift, dynamic pressure and efficiency, a 10% span increase therefore gives a drag ratio of 1/1.1², or 0.826446. That is a 17.355% reduction in this component.
Notice that area cancels in this rearranged force equation. If you reduce area while keeping span and lift fixed, AR increases but required CL also rises. This simplified model predicts unchanged induced drag when e stays fixed. Saying “higher aspect ratio always means less drag” misses what was held constant. A real area change can also change section performance and efficiency.
4. The structural side of the decision
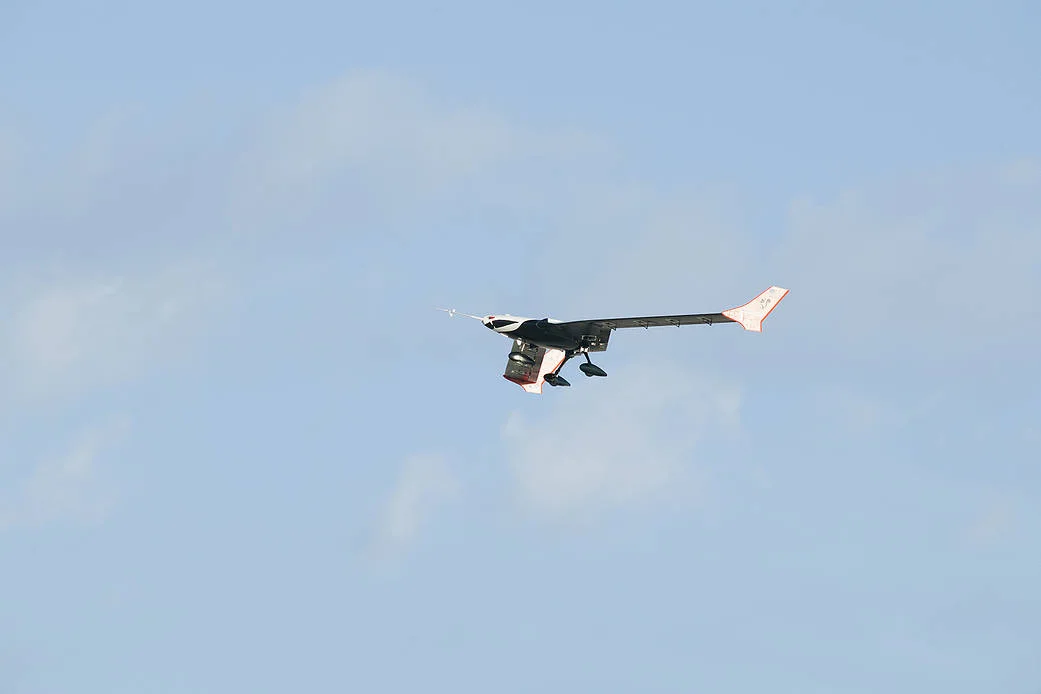
The X-56A programme investigated active flutter suppression and gust-load alleviation for flexible wings. Its research context illustrates the broader challenge: long, slender wings can encounter vibration and bending-load problems that an induced-drag equation cannot resolve. [5]
For a concept review, we recommend keeping a comparison sheet that records both the aerodynamic estimate and the unanswered engineering questions: spar depth, load path, joint design, stiffness, manufacturing access, transport constraints and inspection method. Record what evidence supports each input. The mass in this example stays fixed even when span changes; if the structure becomes heavier, rerun the calculation with the revised mass.
Use sensitivity checks before spending effort on a detailed model. In this calculation, doubling mass at the same speed quadruples induced drag. Doubling speed quarters induced drag at fixed lift, but that is not an argument for flying faster: the other drag components and applicable flow conditions still need evaluation. A useful next model is selected by the question the simple calculation cannot answer.
5. A small code solution you can inspect
The calculator uses a standalone JavaScript module with no calculation libraries or API calls. Download it, save it as induced-drag.mjs, and place the following example in example.mjs in the same folder. Run node example.mjs with Node.js.
import { calculateInducedDrag } from './induced-drag.mjs';

const result = calculateInducedDrag({
  mass: 10, span: 3, area: 0.75,
  speed: 25, density: 1.225, efficiency: 0.8
});

console.log(result.inducedDrag.toFixed(6));
// 1.110639 N
Download the calculation module (.mjs) · View the verification tests
The tests check an independently calculated reference case, the equivalent force equation, scaling with span, mass, speed and efficiency, invariance to area under the stated assumptions, and rejection of missing or invalid inputs. Those checks verify the implementation of the equations. They do not validate the model against a particular aircraft.
Turn an engineering question into a usable tool.
Doubler Aerospace can help scope CAD automation, design reviews and engineering workflow tools. Share the repeated calculation or design handoff that is slowing your team down.
Discuss your project ↗References and image credits
Research review and worked example by Doubler Aerospace. Published 4 October 2026. The photographs document NASA research; NASA has not reviewed or endorsed this article, calculator or Doubler Aerospace.
- Yates, J. E., and Donald, C. D. (1986). A Fundamental Study of Drag and an Assessment of Conventional Drag-Due-to-Lift Reduction Devices. NASA-CR-4004. See the summary and conclusions, particularly the assumptions on report page 46. Full report PDF.
- NASA Glenn Research Center. Induced Drag Coefficient. Aspect ratio, span efficiency and the induced-drag relationship.
- NASA Glenn Research Center. Lift Equation. Lift coefficient and dynamic pressure.
- NASA Glenn Research Center. Drag Equation. Drag force and reference-area consistency.
- NASA. X-56A MUTT Climbs After Liftoff from Rogers Dry Lakebed. Published 9 July 2015. Photo: NASA / Ken Ulbrich.
- NASA. Theseus Remotely Piloted Aircraft. Published 28 September 2009; photograph from May 1996: NASA / Tony Landis.
Images are used editorially with source credits under the NASA media usage guidelines.